
Recruitment Metrics That Actually Matter: A Recruiter's Dashboard

Every recruiter has been in that meeting. Leadership pulls up a dashboard full of numbers, someone asks why time to fill increased by two days, and suddenly you are defending your process instead of improving it. The problem is rarely the recruiter. It is usually the metrics.
Most recruitment metrics dashboards are built for HR directors, not for the people actually filling roles. They track lagging indicators that tell you what already happened but give you nothing to act on. A recruiter staring at last quarter's time to fill is like a driver checking the rearview mirror to steer.
This guide is different. It covers the recruitment metrics that top-billing recruiters actually track to improve their own performance, the benchmarks to measure against, and how to build a weekly dashboard that actually helps you bill more and stress less. Whether you work agency-side or in-house, these are the numbers that predict your next quarter, not just summarize the last one.
Metrics only matter if you act on them. Pair this guide with our recruitment best practices and the fixes in candidate experience to move the numbers you track.
The Metrics That Actually Move the Needle
Not all recruitment metrics are created equal. Some look impressive on a slide deck but do nothing for your day-to-day performance. Others are unglamorous but directly predict whether you will hit your targets.
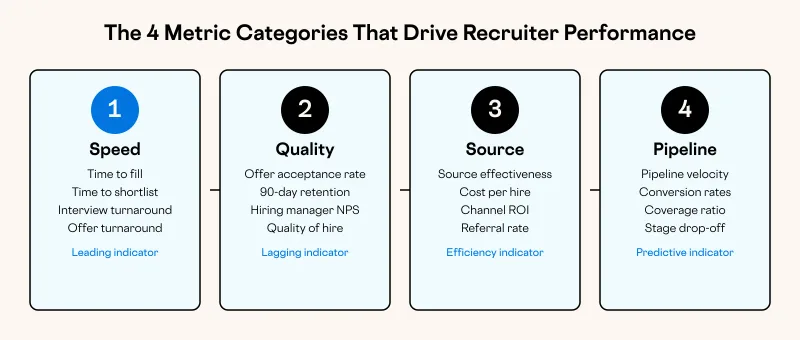
Here are the recruitment metrics that matter most, organized by what they tell you.
Speed Metrics
Time to fill is the headline metric everyone tracks, and it matters, but it is too broad to act on alone. The average time to fill across industries sits around 36 days according to SHRM's benchmarking data, but that number varies wildly by sector, seniority, and location.
Break time to fill into stages to make it actionable:
- Time to first shortlist: How long from receiving a requisition to presenting qualified candidates? If this is more than 5-7 days for a standard search, your sourcing process needs attention.
- Interview turnaround: How long between shortlist submission and first interview? Delays here usually sit with the client or hiring manager, but tracking them gives you data to push back.
- Offer turnaround: Time from final interview to offer extension. This is where deals die. Every day of delay increases the risk of a counteroffer or competitor snatch.
Requisition age is the metric nobody talks about. Tracking how long each open role has been active forces you to confront stalled searches. A role that has been open for 60 days without a shortlist needs a fundamentally different approach, not just more of the same.
Quality Metrics
Offer acceptance rate is arguably the most revealing recruitment metric on your dashboard. An 85%+ offer acceptance rate indicates strong candidate matching, realistic expectation-setting, and effective closing. Below 70%, something is broken: either the roles are being mis-sold, the compensation is not competitive, or candidates are not being prepared properly for the offer.
90-day retention rate measures whether your placements stick. In agency recruiting, this directly affects your rebate exposure and reputation. In-house, it reflects matching quality. The industry benchmark hovers around 85-90%, but top recruiters consistently exceed 92%.
Hiring manager satisfaction is a qualitative metric worth quantifying. A simple post-placement survey (1-5 scale on candidate quality, communication, and process) gives you feedback you can act on. Recruiters who track this consistently identify issues before they become client complaints.
Quality of hire is the holy grail recruitment metric, and the hardest to measure. Proxy measures include performance ratings at 6 months, promotion rates within 2 years, and hiring manager satisfaction. The recruiter who can demonstrate quality of hire with data has a powerful story for leadership presentations and client conversations alike.
Source Metrics
Source effectiveness tracks where your best candidates come from. For every placement, record the original source: LinkedIn, job board, referral, direct application, internal database, or other. After a quarter of tracking, patterns emerge.
Most recruiters are surprised by what they find. Referrals typically deliver the highest quality at the lowest cost, yet receive the least systematic investment. Job boards may generate volume but convert poorly. LinkedIn sourcing might be the most time-intensive channel relative to results.
Cost per hire by source channel makes the picture clearer. Factor in your time, any tool subscriptions, job board fees, and advertising costs. A referral that costs nothing but a 15-minute conversation and places a candidate who stays two years is infinitely more efficient than a paid campaign that generates 200 unqualified applicants.
Pipeline Metrics
Pipeline velocity measures how quickly candidates move through each stage. This is a leading indicator: if velocity slows, your future placements are at risk. Track average days at each stage and investigate outliers.
Conversion rates by stage tell you where candidates are dropping out. If 80% of screened candidates make it to interview but only 20% of interviewed candidates receive offers, the problem is interview performance or role-candidate mismatch, not sourcing.
Pipeline coverage ratio is the metric agency recruiters should live by. For every open role, how many qualified candidates are in your active pipeline? A 3:1 ratio (three qualified candidates per role) is a solid minimum. Below that, you are one withdrawal away from a blown deadline.
Agency Metrics vs In-House Metrics
The recruitment metrics that matter shift depending on your environment.
Agency recruiters are ultimately measured on billings, but the supporting metrics differ from in-house. Revenue per requisition, average fee, and client retention rate are the business metrics that matter. On the operational side, agency recruiters should track submissions-to-interview ratio (indicates shortlist quality), interviews-to-offer ratio (indicates candidate preparation), and sendout-to-placement ratio.
A strong agency recruiter maintains a sendout-to-placement ratio of 3:1 or better. If you are sending eight candidates per placement, either your qualifying process is weak or you are not managing the client's expectations effectively.
In-house recruiters focus on different outcomes. Cost per hire, time to fill, and new hire retention are the core numbers. But the metrics that distinguish top in-house recruiters include hiring manager NPS, internal mobility rate (for those handling internal moves), and candidate pipeline diversity.
In-house recruiters also benefit from tracking source of hire across all channels to optimize their budget allocation. If employee referrals consistently outperform expensive job board postings, that data supports a business case for a referral bonus increase.
Benchmarks by Sector and Seniority
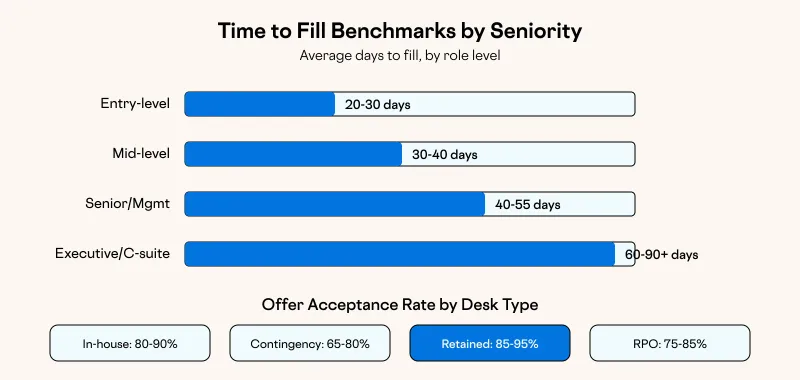
Raw recruitment metrics numbers are meaningless without benchmarks. A 42-day time to fill is terrible for an admin role and excellent for a VP-level search.
By sector:
- Technology: 30-45 days average time to fill, with senior engineering roles stretching to 60+
- Healthcare: 40-50 days average, driven by credential verification and notice periods
- Financial services: 35-50 days, with compliance and background checks adding time
- Professional services: 25-35 days for mid-level, 45-60 for partners and directors
By seniority:
- Entry-level/junior: 20-30 days
- Mid-level professional: 30-40 days
- Senior/management: 40-55 days
- Executive/C-suite: 60-90+ days
Offer acceptance rates by desk type:
- In-house corporate: 80-90%
- Agency (contingency): 65-80%
- Agency (retained): 85-95%
- RPO: 75-85%
These benchmarks come from aggregated industry data including Glassdoor's hiring statistics and SHRM reports. Use them as reference points, not targets. Your own historical performance is always the most relevant benchmark.
Building Your Weekly Dashboard
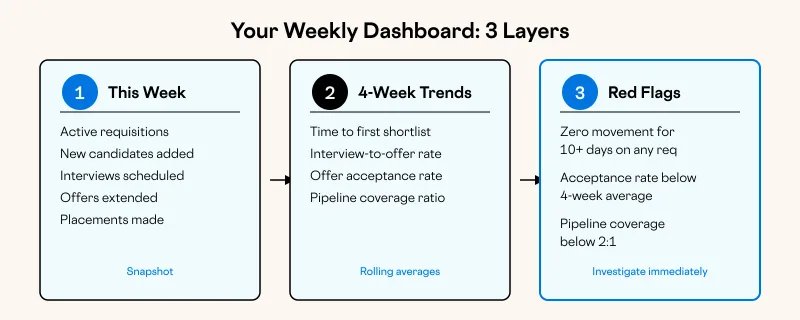
A recruitment metrics dashboard only works if you actually look at it. Weekly reviews are the right cadence: frequent enough to catch problems, infrequent enough to show meaningful trends.
Here is what your weekly dashboard should contain:
This week's snapshot:
- Active requisitions (total and by stage)
- New candidates added to pipeline
- Interviews scheduled this week
- Offers extended and accepted
- Placements made
Trend indicators (rolling 4-week average):
- Time to first shortlist
- Interview-to-offer conversion rate
- Offer acceptance rate
- Pipeline coverage ratio
Red flags (investigate if you see these):
- Any requisition with zero pipeline movement for 10+ days
- Offer acceptance rate dropping below your 4-week average
- Pipeline coverage below 2:1 for any active role
Spend 20-30 minutes every Friday reviewing these recruitment metrics. Look for one thing to fix the following week. That single habit will do more for your numbers than any training course.
When Metrics Become Toxic
Recruitment metrics are tools. In the wrong hands, they become weapons.
If your organization uses metrics primarily to punish rather than improve, you have a culture problem, not a data problem. Metrics should enable better decisions, not create fear. A recruiter who is afraid to report honest numbers will game the system instead of improving it.
The most common toxic metric pattern in recruiting is rewarding speed over quality. When leadership fixates on reducing time to fill without equally weighting retention and hiring manager satisfaction, recruiters cut corners. They push candidates through faster, oversell roles to close deals, and sacrifice long-term relationships for short-term numbers.
Similarly, activity metrics like calls per day, emails sent, and candidates contacted create perverse incentives. A recruiter making 80 low-quality calls a day is less effective than one making 30 highly targeted, well-researched approaches. The right recruitment metrics measure outcomes, not effort.
If you are working in an environment where metrics are used punitively, that is worth thinking about. Your skills and your approach to measurement are valuable. The right employer will appreciate a data-driven recruiter. Explore recruiter roles that value the right metrics and see what is out there.
How to Present Recruitment Metrics to Leadership
Knowing your numbers is one thing. Presenting them effectively is another. Leadership cares about business impact, not recruiting mechanics.
Frame metrics as business outcomes:
- Instead of "time to fill decreased by 3 days," say "we are filling critical roles 3 days faster, reducing vacancy costs by an estimated $X per role"
- Instead of "offer acceptance rate is 87%," say "87% of our first-choice candidates accept, meaning we rarely lose top talent to competitors at the offer stage"
- Instead of "cost per hire is $4,200," say "our cost per hire is 15% below the industry benchmark, saving the business $X annually"
Show trends, not snapshots. A single quarter's numbers are noise. Three quarters of consistent improvement is a story. Always present recruitment metrics as trend lines, and explain what drove the changes.
Connect to revenue. For agency recruiters, this is straightforward: billings and fees. For in-house recruiters, connect your metrics to reduced vacancy costs, lower turnover costs, and the productivity impact of faster hiring. Correlate your placement quality with the salary benchmarks in our recruiter salary guide to put your numbers in market context.
FAQ
What are the most important recruitment metrics for agency recruiters?
The metrics that matter most for agency recruiters are sendout-to-placement ratio, average fee, offer acceptance rate, and revenue per requisition. These directly predict billings. Activity metrics like calls and emails have their place for junior recruiters building habits, but experienced billers should focus on outcomes over activity.
How do I improve time to fill without sacrificing quality?
Focus on the stages that add the most delay. For most recruiters, time to first shortlist and offer turnaround are the biggest opportunities. Build sourcing pipelines proactively so you have candidates ready before a requisition opens. Push back on slow hiring manager feedback with data showing how delays reduce candidate quality as top candidates accept other offers.
What recruitment metrics should I track if I am just starting out?
Start simple: time to fill, offer acceptance rate, source of hire, and pipeline coverage ratio. These four recruitment metrics give you a complete picture without overwhelming complexity. Add more granular metrics as you become comfortable reviewing data weekly.
How do I benchmark my metrics against industry standards?
SHRM publishes annual benchmarking reports. LinkedIn Talent Insights provides industry-specific data. Your ATS likely has built-in benchmarking features as well. The most relevant benchmark is always your own historical performance, so start tracking consistently and measure improvement quarter over quarter.
When should I automate recruitment metrics tracking?
Immediately, if possible. Manual tracking in spreadsheets is better than nothing, but it creates friction that leads to inconsistency. Modern ATS platforms automatically track most core recruitment metrics. If your ATS does not, push for one that does. The time you save on manual data entry is time you can spend actually recruiting.
Ready to put your metrics skills to work somewhere that values data-driven recruiting? Browse recruiter roles on Recruiter Roles and find your next opportunity.